20 Mind-Blowing Mobile App Marketing Statistics for 2026
Mobile apps generated a record $167 billion in consumer spending in 2025, up 10.6% year over year, while downloads hit nearly 150 billion, according to Sensor Tower's State of Mobile 2026 report. Add AppsFlyer's projection of $94.9 billion in app install ad spend and the picture is clear: the app economy keeps growing, and the winners are the teams who acquire, retain, and monetize with current data. Here are 20 verified statistics shaping mobile app marketing in 2026.
The State of the App Economy in 2026
Every number below was re-verified in August 2026 against the most recent primary reports: Sensor Tower’s State of Mobile 2026 (Sensor Tower absorbed data.ai in 2024), AppsFlyer’s annual trends data, RevenueCat’s State of Subscription Apps 2026, and official platform announcements from Google and Apple.
Here is what the data actually says.
1. Consumers Spent a Record $167 Billion in Apps in 2025
Global in-app purchase revenue across the App Store and Google Play surged 10.6% year over year to reach $167 billion in 2025, per Sensor Tower’s State of Mobile 2026.
The market has shifted decisively from growth-at-all-costs to monetization. People are paying more inside apps than ever before.
2. Downloads Hit Nearly 150 Billion, a New All-Time High
Total downloads across iOS and Google Play edged up 0.8% year over year to nearly 150 billion in 2025, surpassing the previous record set in 2023 (Sensor Tower, 2026).
Growth has slowed in mature markets. But make no mistake: this is a mature market, not a saturated one.
3. Users Spent 5.3 Trillion Hours in Apps Last Year
That works out to roughly 3.6 hours per day per mobile user, with total time spent up 3.8% year over year in 2025 (Sensor Tower, 2026).
The mobile screen is still the main screen. Every one of those hours is an acquisition and monetization opportunity for somebody.
4. The US Is the Largest Mobile Market at Nearly $60 Billion
American consumers spent close to $60 billion in apps in 2025, keeping the US the world’s largest mobile market by revenue, while the UK, Germany, and France drove Western Europe’s growth (Sensor Tower, 2026).
Engagement trends diverged sharply by region in 2025, so a one-size-fits-all market strategy leaves money on the table.
5. Non-Game Apps Out-Earned Games for the First Time Ever
2025 marked a genuine milestone: in-app purchase revenue from non-gaming apps surpassed games for the first time (Sensor Tower, 2026).
Non-game IAP revenue climbed 21% year over year and now sits at nearly three times its level five years earlier. Games still approached $82 billion but grew just 1.3%.
6. Generative AI Apps Doubled Their Downloads to 3.8 Billion
GenAI app downloads doubled year over year to 3.8 billion in 2025, in-app purchase revenue nearly tripled to exceed $5 billion, and time spent hit 48 billion hours, roughly 3.6x the 2024 total (Sensor Tower, 2026).
AI is no longer a niche category. It is the growth engine of the entire app store.
User Acquisition Costs and Ad Spend in 2026
Paid UA is still the fastest growth lever in mobile, and it is still where budgets get wasted fastest. We manage paid advertising across gaming and non-gaming accounts every day, and these are the numbers we benchmark against. (For a look at what disciplined UA can do, see our puzzle RPG pre-launch case study.)
7. App Install Ad Spend Was Projected to Hit $94.9 Billion in 2025
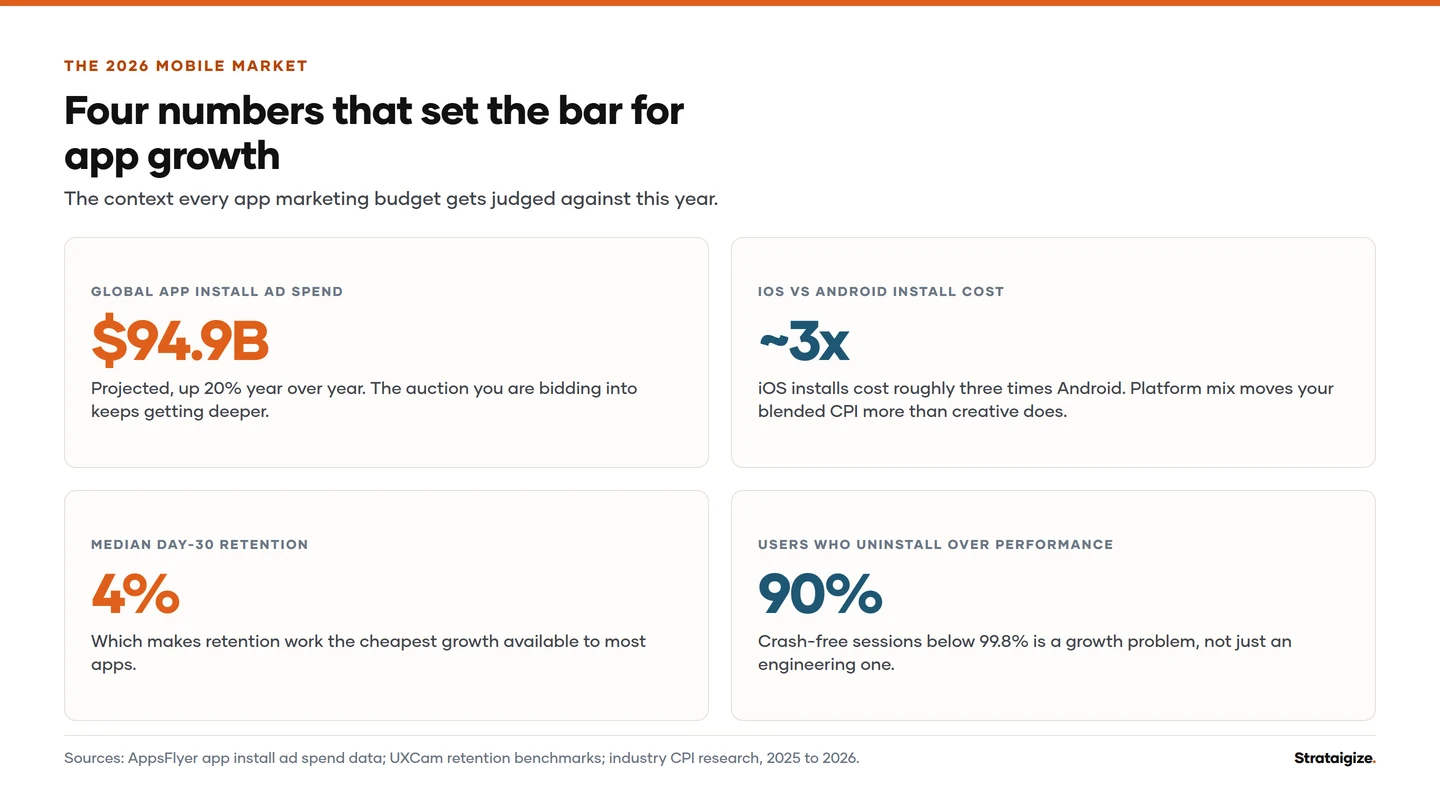
AppsFlyer projected global app install ad spend to climb 20% in 2025 to $94.9 billion (AppsFlyer, 2025).
Privacy changes did not shrink the UA market. They just changed who wins it.
8. Non-Gaming UA Budgets Grew 8% While Gaming Pulled Back 7%
AppsFlyer’s annual trends report measured global UA ad spend at $65 billion in 2024 (excluding China), up 5% year over year. Non-gaming grew 8% while gaming fell 7%, and Finance apps led everything with a 61% surge driven by crypto and fintech (AppsFlyer, 2025).
9. iOS Installs Cost Roughly Three Times More Than Android
Global average cost per install reached $5.84 on iOS in Q1 2026, up 19% year over year, versus $1.92 on Android, up 8%, per AppsFlyer data compiled by Digital Applied (2026).
Platform and geo mix matter more than ever when you plan budgets. Model yours with our ad spend calculator before you commit.
10. Remarketing Conversions Grew 10x Faster Than Paid Installs
Paid remarketing conversions grew 22% in 2024, versus just 2% growth in paid installs (AppsFlyer, 2025).
The cheapest conversion is a user who already installed your app. If your budget is 100% cold acquisition, you are overpaying for growth.
Retention Benchmarks: The Hard Truth in 2026
11. Roughly 96% of New Users Are Gone by Day 30
Median day-30 retention across all app categories sits around 4% in 2026, and a typical app loses 75% of its users within the first three days after install, per UXCam’s 2026 retention benchmarks, compiled from AppsFlyer and Adjust data.
If you are not investing in onboarding, engagement, and lifecycle messaging, you are lighting UA money on fire.
12. The Retention Curve Is Steepest in Week One
Median day-1 retention is about 25%, day-7 falls to 8%, and day-30 lands at 4%; strong performers at the 75th percentile hold 5-8% at day 30 (UXCam, 2026).
Measure the right things early. Our guide to the 10 mobile app KPIs that matter shows which numbers predict long-term health.
13. Retention Varies Wildly by Category
Day-30 median retention in 2026: social apps around 12%, productivity 8%, fintech 7%, health and fitness 5%, gaming 3%, ecommerce 2% (UXCam, 2026).
Benchmark against your own vertical, not the whole market. A 5% day-30 number is a win for a game and a red flag for a neobank.
14. First-Session Activation Predicts Everything
Apps whose users complete a meaningful first action in session one retain at 2 to 3 times the rate of apps that do not, regardless of category (UXCam, 2026).
The highest-leverage retention work happens in the first five minutes of the user journey, not in month two.
Monetization and Subscription Trends
15. Hybrid Monetization Keeps Outperforming
In-app advertising revenue grew 26% in non-gaming and 7% in gaming during 2024, driven by hybrid models that blend ads with purchases; midcore games alone saw a 21% jump in ad revenue (AppsFlyer, 2025).
Ads or IAP is a false choice. The winners run both.
16. Betting, Lending, and Food Delivery Are the Momentum Categories
In 2025, global downloads rose 24% for sports betting apps and 18% for credit and lending apps, while restaurant and food delivery apps grew 14%, pushing past their pandemic-era peak (Sensor Tower, 2026).
Category momentum shifts fast. What was hot in 2023 is not what is hot now.
17. Nearly 15,000 New Subscription Apps Launch Every Month
RevenueCat’s State of Subscription Apps 2026, built on more than 115,000 apps and $16 billion in tracked revenue, counts close to 15,000 new subscription apps per month in early 2026, roughly seven times the 2022 rate.
Subscriptions are now the default monetization model for non-game apps, which means the paywall bar keeps rising.
18. Subscription Growth Is Concentrating at the Top
The median subscription app grew monthly recurring revenue just 5.3% year over year, while the top 10% grew 306% (RevenueCat, 2026). North American subscribers deliver a median $32 in first-year revenue per payer versus $23 globally.
Average execution no longer compounds. Pricing, paywall, and retention discipline separate the leaders from everyone else.
Privacy and Measurement in 2026
19. Google Killed Privacy Sandbox on Android
In October 2025, Google retired the Privacy Sandbox program, including the Attribution Reporting, Topics, and Protected Audience APIs, after years of limited industry adoption (Google, 2025).
The long-feared Android version of ATT never landed. GAID-based targeting survives for now, but the direction of travel on privacy has not changed. Keep building first-party data and incrementality measurement anyway.
20. Apple Moved On: Apple Ads and AdAttributionKit
Apple renamed Apple Search Ads to Apple Ads in April 2025 as its advertising business expanded beyond search placements, and AdAttributionKit is succeeding SKAdNetwork as the privacy-preserving attribution framework on iOS (Apple, 2025).
If your team still runs a 2023-era SKAN playbook, your measurement is already a generation behind.
What Does All This Mean for You?
If there is a single theme in the 2026 data, it is this: the fundamentals have not changed, but the bar keeps rising.
Get users. Keep them. Monetize well. Repeat.
- Invest smarter in UA. iOS installs cost roughly 3x Android, remarketing grows faster than cold installs, and finance-style LTV math is spreading to every vertical.
- Focus on retention. A 4% day-30 median means retention work is the cheapest growth you will ever buy.
- Diversify monetization. Hybrid ad-plus-IAP models and disciplined subscription pricing are outperforming single-revenue strategies.
- Play the long game on privacy. Privacy Sandbox died, but the privacy era did not. First-party data wins either way.
The opportunity is still massive. A $167 billion consumer spend market does not lie. The brands that win in 2026 will be those who adapt fastest and respect what the data is telling them.
Good read: Google Ads Statistics 2026
FAQ
How much does it cost to acquire a mobile app user in 2026?
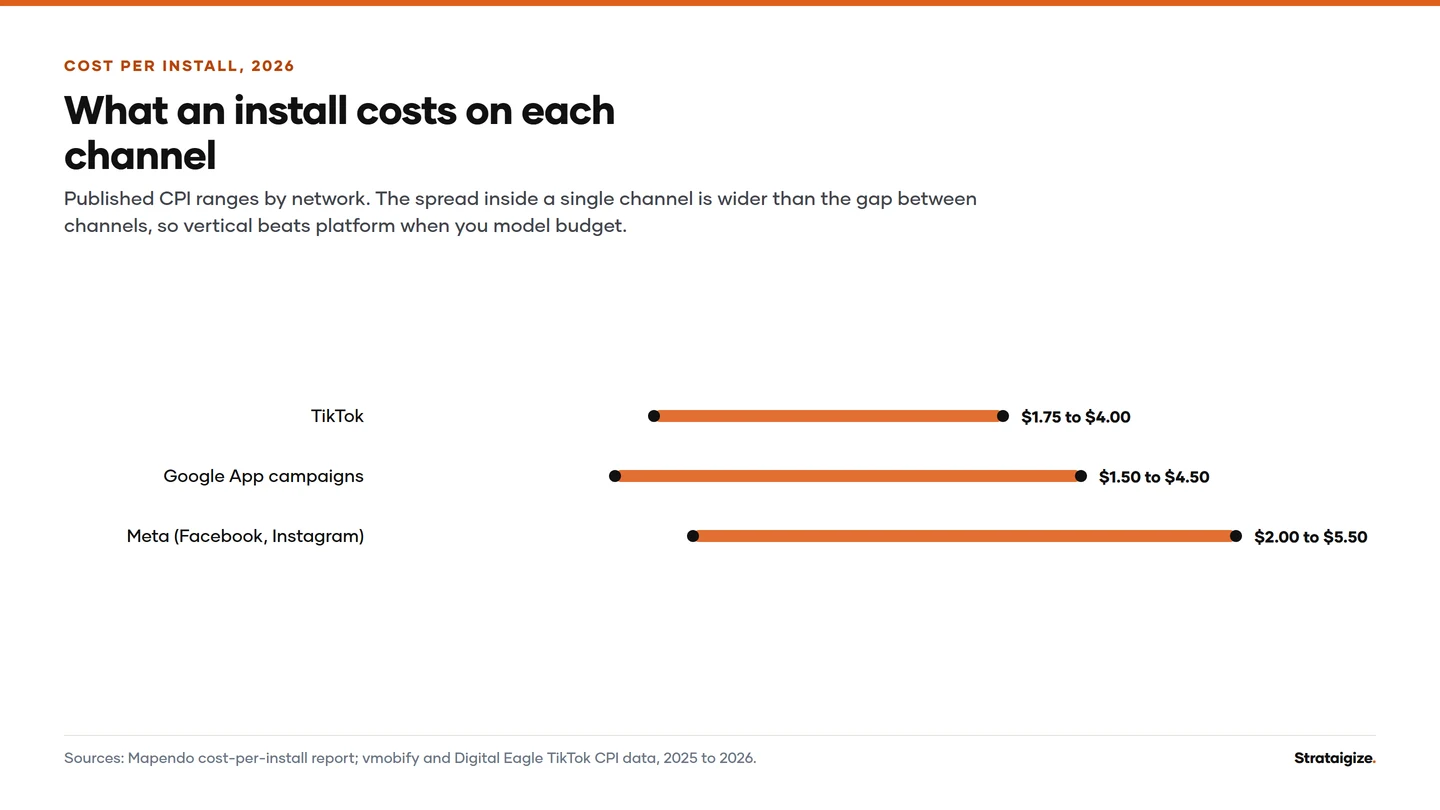
Global average CPI reached $5.84 on iOS and $1.92 on Android in Q1 2026, per AppsFlyer data compiled by Digital Applied. Actual costs vary widely by geography, vertical, and ad format: finance and other high-LTV categories pay well above average, while casual gaming installs in emerging markets can cost under a dollar.
What is a good day-30 retention rate in 2026?
The median across all categories is about 4%, and 5-8% marks a strong performer, according to UXCam’s 2026 benchmarks. Judge yourself against your vertical: social apps hold a 12% median at day 30, fintech 7%, gaming just 3%.
How big is the mobile app economy in 2026?
Per Sensor Tower’s State of Mobile 2026, consumers spent $167 billion on in-app purchases in 2025 (up 10.6%), downloaded apps nearly 150 billion times, and spent 5.3 trillion hours in apps. Non-game apps out-earned games for the first time.
What replaced SKAdNetwork and Privacy Sandbox?
Google retired Privacy Sandbox on Android in October 2025, so GAID-based measurement continues for now. On iOS, Apple’s AdAttributionKit is succeeding SKAdNetwork, and Apple Search Ads rebranded to Apple Ads in April 2025. Either way, first-party data and incrementality testing are the durable foundation.
Ready to Grow? Why Leading Apps Work with Strataigize Marketing
If you’re looking to turn these insights into real growth, Strataigize Marketing is here to help. Based in Vancouver and proudly serving clients across Canada, the USA, and Australia, we specialize in helping mobile apps succeed globally.
We are obsessive about performance marketing, user acquisition, retention strategy, and app store optimization that drives real results, not vanity metrics.
From fintech to gaming, ecommerce to health, we understand what it takes to win in today’s mobile landscape.
Book a marketing audit today and discover how we can help you scale smarter, spend wiser, and outperform your competition.
References
- Sensor Tower. (2026, January). 2026 State of Mobile: AI Moves Mobile into Its Next Phase.
- AppsFlyer. (2025). Global app install ad spend projected to rise 20% to $94.9B in 2025.
- AppsFlyer. (2025, January). Top Data Trends: Global App Market Insights.
- Digital Applied. (2026, April). Mobile App Marketing Statistics 2026: Install Data.
- UXCam. (2026, April). Mobile App Retention Benchmarks by Industry.
- RevenueCat. (2026, March). State of Subscription Apps 2026.
- Google. (2025, October). Update on Plans for Privacy Sandbox Technologies.
- Apple. (2025). AdAttributionKit Developer Documentation.